FINANCIAL INFORMATION
Check the present and future of Hwashin with its investment information.

- IR
- FINANCIAL INFORMATION
-
Balance Sheet
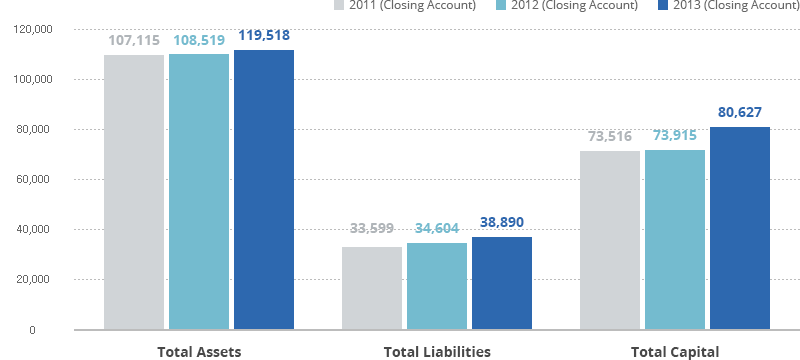
Balance Sheet Item 2011 (Closing Account) 2012 (Closing Account) 2013 (Closing Account) Amount
(₩ million)Component
Ratio(%)Rate of
Change(%)Amount
(₩ million)Component
Ratio(%)Rate of
Change(%)Amount
(₩ million)Component
Ratio(%)Rate of
Change(%)Total Assets 107,115 100.00 53.10 108,519 100.00 1.30 119,518 100.00 10.10 Total Liabilities 33,599 31.40 23.50 34,604 31.90 3.00 38,890 32.50 12.40 Total Capital 73,516 68.60 71.90 73,915 68.10 0.50 80,627 67.50 9.10 Sales
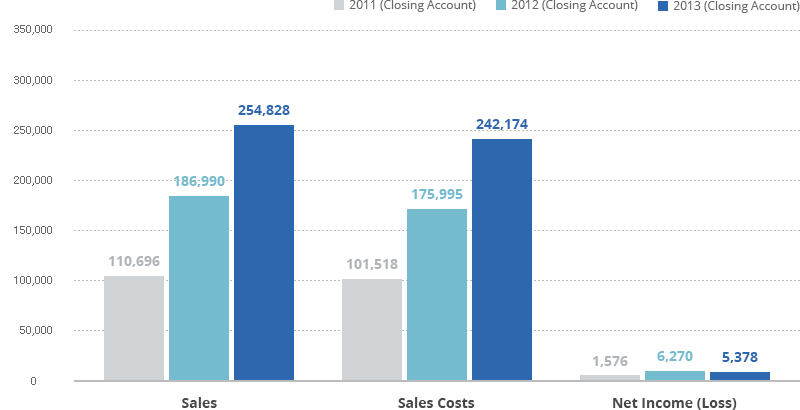
Sales Item 2011 (closing Account) 2012 (closing Account) 2013 (closing Account) Amount
(₩ million)Component
Ratio(%)Rate of
Change(%)Amount
(₩ million)Component
Ratio(%)Rate of
Change(%)Amount
(₩ million)Component
Ratio(%)Rate of
Change(%)Sales 110,696 100 30.6 186,990 100 68.9 254,828 100 36.3 Sales Costs 101,518 91.7 32.4 175,995 94.1 73.4 242,174 95 37.6 Gross Profits on Sales (Loss) 9,177 8.3 13.6 10,995 5.9 19.8 12,654 5 15.1 Selling & General Administration Expenses 7,332 6.6 183.9 3,788 2 -48.3 4,443 1.7 17.3 Operating Profits (Loss) 1,845 1.7 -66.4 7,207 3.9 290.6 8,210 3.2 13.9 Non-Operating Profits 1,142 1 55.8 1,499 0.8 31.3 920 0.4 -38.7 Non-Operating Expenses 381 0.3 83.1 625 0.3 64.1 1,234 0.5 97.2 Continuing Income (Loss) before Income Taxes 2,606 2.4 -56.7 8,081 4.3 210.1 7,896 3.1 -2.3 Income Tax (Corporate Tax) Expenses (Corporate Tax) for Ongoing Business Income or Loss 1,030 0.9 -11.2 1,811 1 75.9 2,518 1 39.1 Net Income (Loss) 1,576 1.4 -67.6 6,270 3.4 297.8 5,378 2.1 -14.2 -
Balance Sheet
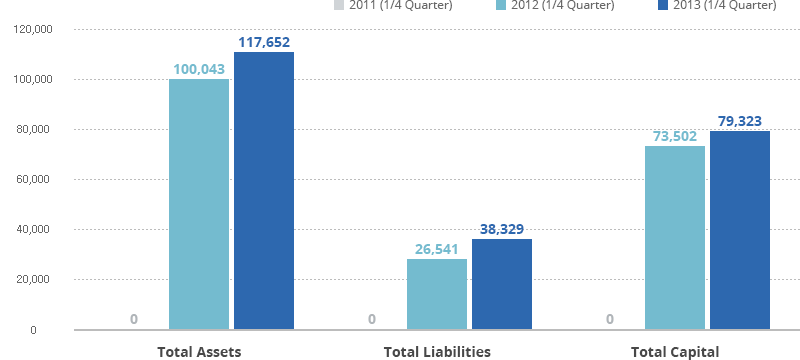
Balance Sheet Item 2011 (1/4 Quarter) 2012 (1/4 Quarter) 2013 (1/4 Quarter) Amount
(₩ million)Component
Ratio(%)Rate of
Change(%)Amount
(₩ million)Component
Ratio(%)Rate of
Change(%)Amount
(₩ million)Component
Ratio(%)Rate of
Change(%)Total Assets 0 0 0 100,043 100 0 117,652 100 17.6 Total Liabilities 0 0 0 26,541 26.5 0 38,329 32.6 44.4 Total Capital 0 0 0 73,502 73.5 0 79,323 67.4 7.9 Sales
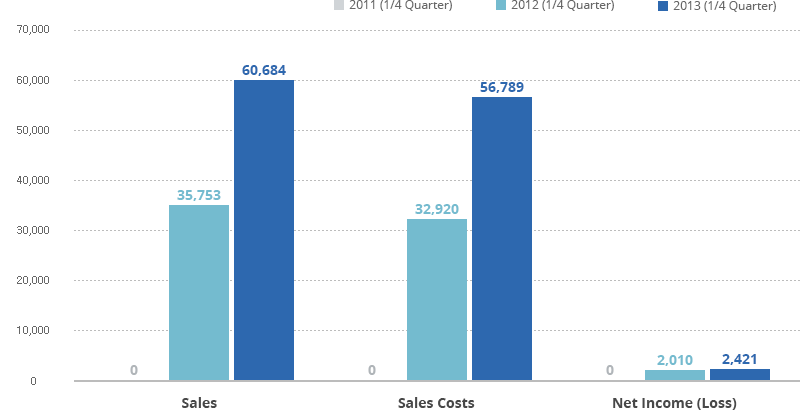
Sales Item 2011 (1/4 Quarter) 2012 (1/4 Quarter) 2013 (1/4 Quarter) Amount
(₩ million)Component
Ratio(%)Rate of
Change(%)Amount
(₩ million)Component
Ratio(%)Rate of
Change(%)Amount
(₩ million)Component
Ratio(%)Rate of
Change(%)Sales 0 0 0 35,753 100 0 60,684 100 69.7 Sales Costs 0 0 0 32,920 92.1 0 56,789 93.6 72.5 Gross Profits on Sales (Loss) 0 0 0 2,833 7.9 0 3,895 6.4 37.5 Selling & General Administration Expenses 0 0 0 775 2.2 0 873 1.4 12.6 Operating Profits (Loss) 0 0 0 2,058 5.8 0 3,023 5 46.9 Non-Operating Profits 0 0 0 437 1.2 0 257 0.4 -41.2 Non-Operating Expenses 0 0 0 22 0.1 0 159 0.3 627.5 Continuing Income (Loss) before Income Taxes 0 0 0 2,473 6.9 0 3,120 5.1 26.2 Income Tax (Corporate Tax) Expenses (Corporate Tax) for Ongoing Business Income or Loss 0 0 0 463 1.3 0 699 1.2 51 Net Income (Loss) 0 0 0 2,010 5.6 0 2,421 4 20.5 -
Balance Sheet
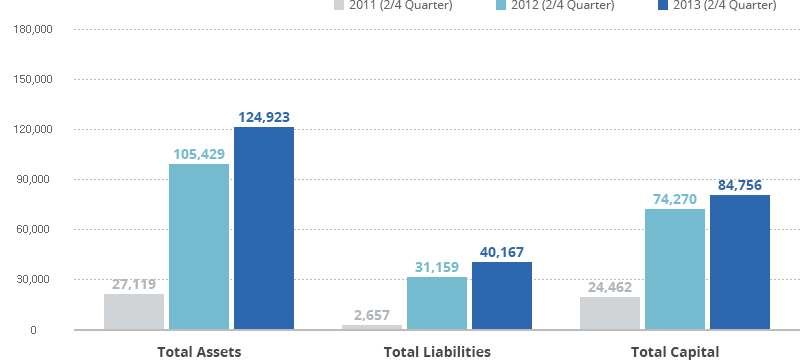
Balance Sheet Item 2011 (2/4 Quarter) 2012 (2/4 Quarter) 2013 (2/4 Quarter) Amount
(₩ million)Component
Ratio(%)Rate of
Change(%)Amount
(₩ million)Component
Ratio(%)Rate of
Change(%)Amount
(₩ million)Component
Ratio(%)Rate of
Change(%)Total Assets 27,119 100 0 105,429 100 288.8 124,923 100 18.5 Total Liabilities 2,657 9.8 0 31,159 29.6 1,072.70 40,167 32.2 28.9 Total Capital 24,462 90.2 0 74,270 70.4 203.6 84,756 67.8 14.1 Sales
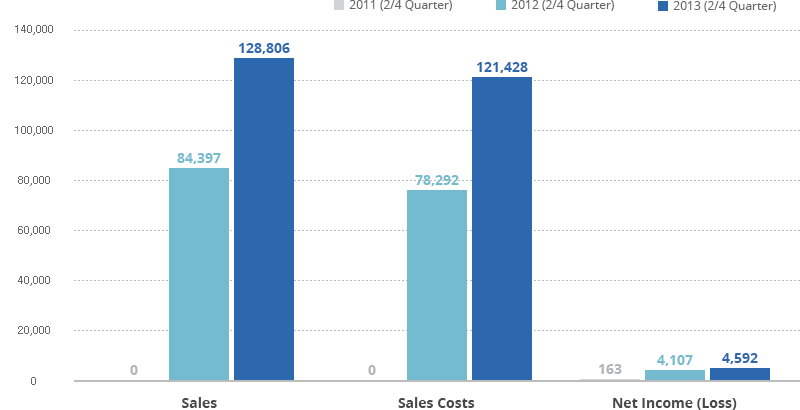
Sales Item 2011 (2/4 Quarter) 2012 (2/4 Quarter) 2013 (2/4 Quarter) Amount
(₩ million)Component
Ratio(%)Rate of
Change(%)Amount
(₩ million)Component
Ratio(%)Rate of
Change(%)Amount
(₩ million)Component
Ratio(%)Rate of
Change(%)Sales 0 0 0 84,397 100 0 128,806 100 52.6 Sales Costs 0 0 0 78,292 92.8 0 121,428 94.3 55.1 Gross Profits on Sales (Loss) 0 0 0 6,105 7.2 0 7,378 5.7 20.8 Selling & General Administration Expenses 173 888.8 0 1,582 1.9 813.8 1,775 1.4 12.2 Operating Profits (Loss) -173 888.8 0 4,523 5.4 2712.2 5,602 4.3 23.9 Non-Operating Profits 447 888.8 0 965 1.1 116 644 0.5 -33.2 Non-Operating Expenses 57 888.8 0 179 0.2 215.7 360 0.3 100.6 Continuing Income (Loss) before Income Taxes 217 888.8 0 5,308 6.3 2349.2 5,887 4.6 10.9 Income Tax (Corporate Tax) Expenses (Corporate Tax) for Ongoing Business Income or Loss 54 888.8 0 1,201 1.4 2136.8 1,295 1 7.8 Net Income (Loss) 163 888.8 0 4,107 4.9 2419.1 4,592 3.6 11.8 -
Balance Sheet
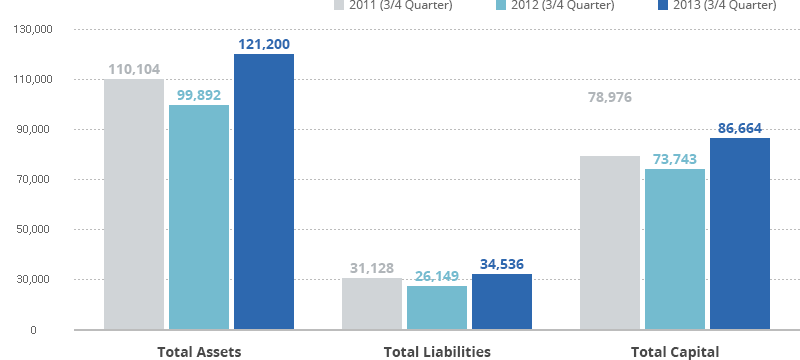
Balance Sheet Item 2011 (3/4 Quarter) 2012 (3/4 Quarter) 2013 (3/4 Quarter) Amount
(₩ million)Component
Ratio(%)Rate of
Change(%)Amount
(₩ million)Component
Ratio(%)Rate of
Change(%)Amount
(₩ million)Component
Ratio(%)Rate of
Change(%)Total Assets 110,104 100 0 99,892 100 -9.3 121,200 100 21.3 Total Liabilities 31,128 28.3 0 26,149 26.2 -16 34,536 28.5 32.1 Total Capital 78,976 71.7 0 73,743 73.8 -6.6 86,664 71.5 17.5 Sales
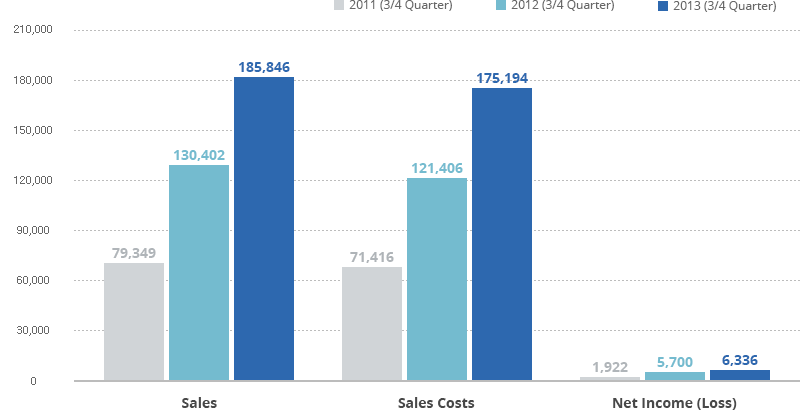
Sales Item 2011 (3/4 Quarter) 2012 (3/4 Quarter) 2013 (3/4 Quarter) Amount
(₩ million)Component
Ratio(%)Rate of
Change(%)Amount
(₩ million)Component
Ratio(%)Rate of
Change(%)Amount
(₩ million)Component
Ratio(%)Rate of
Change(%)Sales 79,349 100 0 130,402 100 64.3 185,846 100 42.5 Sales Costs 71,416 90 0 121,406 93.1 70 175,194 94.3 44.3 Gross Profits on Sales (Loss) 7,934 10 0 8,996 6.9 13.4 10,651 5.7 18.4 Selling & General Administration Expenses 6,649 8.4 0 2,421 1.9 -63.6 2,722 1.5 12.4 Operating Profits (Loss) 1,285 1.6 0 6,575 5 411.6 7,929 4.3 20.6 Non-Operating Profits 1,678 2.1 0 1,096 0.8 -34.7 687 0.4 -37.3 Non-Operating Expenses 196 0.2 0 294 0.2 50.1 456 0.2 55 Continuing Income (Loss) before Income Taxes 2,767 3.5 0 7,377 5.7 166.6 8,160 4.4 10.6 Income Tax (Corporate Tax) Expenses (Corporate Tax) for Ongoing Business Income or Loss 845 1.1 0 1,678 1.3 98.5 1,824 1 8.8 Net Income (Loss) 1,922 2.4 0 5,700 4.4 196.5 6,336 3.4 11.2


